[[0.34510002 0.35581295 0.51991515 0.62525183 0.81535178 0.12125815
  0.15329005 0.66312261 0.69766253 0.39787653 0.904016   0.50356198
  0.32065185 0.67831745 0.12224857 0.77499728 0.4150491  0.09627354
  0.59027217 0.8228631  0.73747623 0.33060461 0.15976675 0.52252264
  0.81072653 0.6283138  0.80770401 0.2950764  0.64603806 0.9534656 ]
 [0.15344875 0.69475993 0.57474922 0.30644868 0.27496589 0.42523631
  0.97781169 0.62006382 0.744538   0.54043089 0.89226521 0.57481534
  0.08411393 0.39198813 0.60989401 0.92473201 0.31694018 0.78857376
  0.2965276  0.0845176  0.73828398 0.43259803 0.9893683  0.43654242
  0.02423974 0.26014556 0.71855925 0.92979247 0.58448328 0.82070256]]
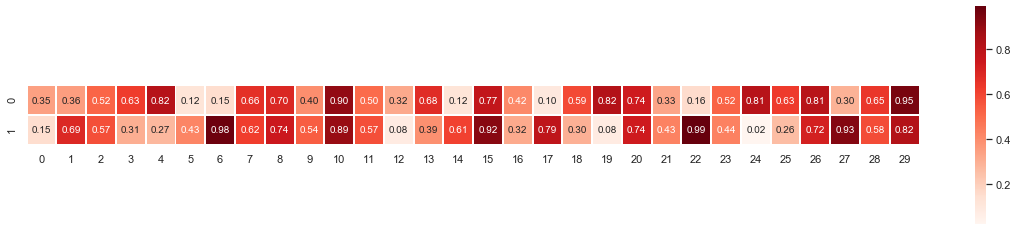
cmap='Reds' # colorbar
fig = plt.subplots(figsize=(20 , 4))
ax1 = plt.subplot(1,1,1)
ss = sns.heatmap(flights, annot=True, annot_kws={'size':10,},linewidths=1, ax=ax1, square=True,fmt = '.2f',\
        cmap=cmap) #,cbar_kws={"orientation": "horizontal" }


# annot_kws 文字字体大小
# square=True 保持正方形
# fmt = '.2f' 显示格式
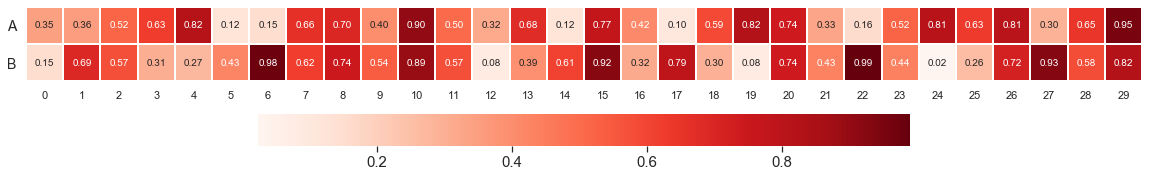
fig = plt.subplots(figsize=(20 , 4))
ax2 = plt.subplot(1,1,1)
ss2 = sns.heatmap(flights, annot=True, annot_kws={'size':10,},linewidths=1, ax=ax2, square=True,fmt = '.2f',\
        cmap=cmap ,cbar_kws={"orientation": "horizontal" }) #

ax2.set_yticklabels(['A','B'],rotation='horizontal',fontsize=14)
# ax.set_xticklabels(list2str(17),fontsize=16)

cax = plt.gcf().axes[-1] #设置坐标轴字体大小
cax.tick_params(labelsize=15)